Monday, December 26, 2016

Technical Analysis Dec 2016: K1 (0111)


K-ONE TECHNOLOGY BHD 

Observation From Chart:-

K1 rebound from RM0.13 support level.

How about this round, will it breakout downtrend resistance level?

Other indicator:-
MACD trade at negative region, downtrend sign.
Stochastic %K on BUY call itinerary.

Immediate support is RM0.13 level,
Subsequent support is RM0.10 level.

Immediate resistance, RM0.16 level.
Subsequent resistance, RM0.18 level.

Let's watch closely.

Tuesday, December 6, 2016

Technical Analysis Dec 2016: YTL (4677)


YTL CORPORATION BERHAD 

Observation from Chart:-

YTL succeed breakout downtrend resistance level.

How high will it go?

Other indicator:-
MACD trade at negative region, downtrend sign.
Stochastic %K on BUY call itinerary.

Immediate resistance @ RM1.60 level.
Subsequent resistance @ RM1.64 level.

Immediate support @ RM1.50 level.
Subsequent support @ RM1.44 level.

Let's watch closely.

Sunday, December 4, 2016

Technical Analysis Dec 2016: MEXTER (0075)


MEXTER TECHNOLOGY BHD (0075) 

Observation from Chart:-

MEXTER forming descending triangle pattern.

Will it retest RM0.21 support level?

Other indicator:-
MACD trade at negative region, downtrend sign.
Stochastic %K on BUY call itinerary.

Immediate resistance @ RM0.25 level.
Subsequent resistance @ RM0.265 level.

Immediate support @ RM0.21 level.
Subsequent support @ RM0.19 level.

If break the strong support, RM0.21 level, lower low is formed.
Potential facing high selling pressure.

Let's watch closely.

Technical Analysis Dec 2016: DAYANG (5141)


DAYANG ENTERPRISE HOLDINGS BERHAD 

Observation from Chart:-

DAYANG retest downtrend resistance level.

Will it breakout & go higher?

Other indicator:-
MACD trade at negative region, downtrend itinerary.
Stochastic %K on BUY call.

Immediate resistance @ RM0.905
Subsequent resistance @ RM0.96

Immediate support @ RM0.805
Subsequent support @ RM0.745

Let's watch closely...

Sunday, November 27, 2016

Technical Analysis Nov 2016: OLDTOWN (5201)


OLDTOWN BERHAD 

Observation from Chart:-

OLDTOWN gap down with huge volume.

Will it retest RM1.695 support level ?

Other indicator:-
MACD trade at positive region, uptrend sign.
Stochastic %K on SELL call itinerary.

Immediate resistance @ RM1.95 level.
Subsequent resistance @ RM2.02 level.

Immediate support @ RM1.695 support level.
Subsequent support @ RM1.61 level.

Let's watch closely.

Technical Analysis Nov 2016: OPENSYS (0040)


OPENSYS (M) BHD 

Observation from Chart:-

OPENSYS (0040) retrace down from RM0.415 high

Will it rebound @ RM0.33 support level?

Other indicator:-
MACD moving toward positive region, uptrend sign.
Stochastic %K on SELL call itinerary.

Immediate resistance @ RM0.37 level.
Subsequent resistance @ RM0.415 level.

Immediate support @ RM0.33 level.
Subsequent support @ RM0.305 level.

Let's watch closely.

Saturday, November 5, 2016

Technical Analysis Nov 2016: MYEG (0138)


MY E.G. SERVICES BHD (0138) 

Observation From Chart:-

MYEG forming higher high & higher low.

Will it rebound @ support level ?

Other indicator:-
MACD trade at positive region, uptrend sign.
Stochastic %K on SELL call itinerary.

Immediate support @ RM2.26 level.
Subsequent support @ RM2.22 level.

Immediate resistance @ RM2.40 level.
Subsequent resistance @ RM2.51 level.

Positive news on MYEG:-
29 August 2016 , MYEG proposed one (1) Bonus Share for every two (2) existing MYEG Shares held on an entitlement date to be determined later ("Proposed Bonus Issue"). For more info, pls refer http://www.bursamalaysia.com/
Based on pass history, bonus issue held on Oct / Dec.
Today already November so perhaps Bonus issue will be fall on coming December.

Let's watch closely.

Saturday, October 29, 2016

Technical Analysis Oct 2016: EFORCE (0065)


EXCEL FORCE MSC BHD (0065) 

Observation from Chart:

EFORCE (0065) forming descending triangle pattern.

When will it breakout?

Other indicator:- 
MACD trade at positive region, uptrend sign.
Stochastic %K on SELL call itinerary.

Immediate resistance @ RM1.62 level.
Subsequent resistance @ RM1.64 level.

Immediate support @ RM1.50 level.
Subsequent support @ RM1.445 level.

Let's watch closely.

Thursday, October 27, 2016

Technical Analysis Oct 2016: BHS (7241)


BHS INDUSTRIES BHD (7241) 

Observation from Chart:

BHS succeed breakout bolinger band squeeze.

How high will it go?

Other indicator:-

MACD trade at positive region, uptrend sign.
Stochastic %K on BUY call itinerary.

Immediate resistance @ RM0.46 level.
Subsequent resistance @ RM0.49 level.

Immediate support @ RM0.44 level.
Subsequent support @ RM0.42 level.

Let's watch closely.

Sunday, October 23, 2016

Technical Analysis Oct 2016: GAMUDA (5398)


GAMUDA BERHAD (5398) 

Observation from Chart:

GAMUDA succeed breakout bolinger band squeeze. 

How high will it go?

Other indicator:-
MACD trade at positive region, uptrend sign.
Stochastic %K on BUY call itinerary.

Immediate resistance @ RM5.00 level.
Subsequent resistance @ RM5.10 level.

Immediate support @ RM4.91 level.
Subsequent support @ RM4.87 level.

Let's watch closely.

Saturday, October 22, 2016

Technical Analysis Oct 2016: SUPERMX (7106)

SUPERMAX CORPORATION BERHAD 

Observation From Chart:-

SUPERMX forming bolinger band squeeze

When will it break out?

Other indicator:-
MACD trade @ positive region, uptrend sign.
Stochastic %K @ trigger BUY call, pending confirmation.

Immediate resistance @ RM2.30 level.
Subsequent resistance @ RM2.40 level.

Immediate support @ MA20 which is RM2.20 level.
Subsequent support @ RM2.04 level.

Let's watch closely
.

Sunday, October 9, 2016

Technical Analysis Oct 2016: IJM (3336)


IJM CORPORATION BERHAD 

Observation from Chart:-

IJM is forming lower high & lower low.

How low will it go?

Other indicator:-
MACD trade at negative region, downtrend sign.
Stochastic %K on BUY call itinerary.

High probably it will retest downtrend resistance level which is around RM3.40 level.

Immediate support @ RM3.28 level.
Subsequent support @ RM3.21 level.

Immediate resistance @ RM3.40 level.
Subsequent support @ RM3.45 level.

Let 's watch closely.

Saturday, October 8, 2016

Technical Analysis Oct 2016: WILLOW (0008)


WILLOWGLEN MSC BHD 

Observation from Chart:

WILLOW (0008) succeed breakout bolinger band squeeze & forming higher high.

How high will this round go?

Other indicator:-
MACD trade at positive region, uptrend sign.
Stochastic %K on BUY call itinerary.

Immediate resistance @ RM0.775
Subsequent resistance @ RM0.795

Immediate support @ RM0.72 level.
Subsequent support @ RM0.69 level.

Let's watch closely.

Technical Analysis Oct 2016: GBGAQRS (5226)


GABUNGAN AQRS BERHAD (5226) 

Observation from Chart:

GBGAQRS (5226) retrace down from RM1.18 high level to RM0.85  (-27.5%)

Will it rebound @ RM0.85 strong support level?

Other indicator:-
MACD trade at negative region, downtrend sign.
Stochastic %K oversold, pending trigger BUY call.

Immediate resistance @ RM0.93level.
Subsequent resistance @ RM0.965 level.

Immediate support @ RM0.85 level.
Subsequent support @ RM0.82 level.

Let's watch closely for technical rebound

Sunday, October 2, 2016

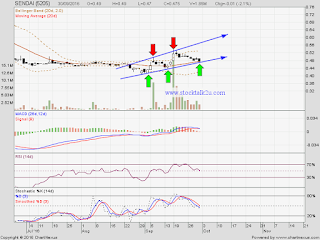
Technical Analysis Oct 2016: SENDAI (5205)

EVERSENDAI CORPORATION BERHAD

Observation from Chart:

SENDAI (5205) retrace down from RM0.535 high & retest support level.

Will it rebound @ support level?

Other indicator:-
MACD moving toward positive region, uptrend sign.
Stochastic %K on SELL call itinerary.

Immediate resistance @ RM0.535 level.
Subsequent resistance @ RM0.595 level.

Immediate support @ RM0.475 level.
Subsequent support @ RM0.435 level.

Let's watch closely.

Saturday, October 1, 2016

Technical Analysis Oct 2016: OWG (5260)


ONLY WORLD GROUP HOLDINGS BERHAD (5260) 

Observation from Chart:-

OWG forming double bottom @ RM1.84 level.

Will it breakout RM2.26 resistance level & go higher?

Other indicator:-
MACD trade @ positive region, uptrend sign.
Stochastic %K @ pending trigger buy call.

Immediate support @ RM2.16. level.
Subsequent support @ RM2.19 level.
Next support @ RM2.14 level

Immediate resistance @ RM2.26 level.
Subsequent resistance @ RM2.33 level.

Let's watch closely.

Monday, September 26, 2016

Technical Analysis Sept 2016: BJTOTO (1562)


BERJAYA SPORTS TOTO BERHAD 

Observation from Chart:-

BJTOTO succeed breakout RM3.40 resistance level.

How high will it go?

Other indicator:-
MACD trade @ positive region, uptrend sign.
Stochastic %K @ on buy call itinerary.

Immediate support @ RM3.40 level.
Subsequent support @ RM3.35 level.

Immediate resistance @ RM3.50 level.
Subsequent resistance @ RM3.56 level.

Let's watch closely.

Wednesday, September 21, 2016

Pre-GE14: Technical Outlook of GAMUDA (5398)


GAMUDA BERHAD (5398) 

Observation from Chart:

GAMUDA forming bolinger band squeeze.

Will it breakout & go higher?

Flash back, Pre & Post GE13 GAMUDA history,
Stage 1, Bolinger band squeeze
Stage 2, Breakout & higher high, higher low
Stage 3, Gap up after election


How do you think on upcoming Pre & Post GE14 ?

Let's watch closely.

Sunday, September 18, 2016

Technical Analysis Sept 2016: YONGTAI (7066)


YONG TAI BHD (7066) 

Observation from Chart:-

YONGTAI (7066) forming symmetrical triangle pattern.

When will it breakout ?

Other indicator:-
MACD at positive region, uptrend sign.
Stochastic %K trigger BUY call, pending confirmation.

Immediate resistsnce @ RM1.12 level.
subsequent resistance @ RM1.14 level.

Immediate support @ RM1.07 level.
Subsequent support @ RM1.04 level.

Let's watch closely.

Technical Analysis Sept 2016: YEELEE (5584)


YEE LEE CORPORATION BHD (5584) 

Observation from Chart:-

YEELEE forming lower high & lower low.

How low will it go?

Other indicator:-
MACD at negative region, downtrend sign.
Stochastic %K at SELL call itinerary.

Immediate support @ RM2.24 level.
Subsequent support @ RM2.19 level.

Immediate resistance @ RM2.28 level.
Subsequent resistance @ RM2.35 level
.
Lower low been confirmed, it's on downtrend.

Let's watch closely.

Thursday, September 15, 2016

Technical Analysis Sept 2016: GAMUDA (5398)


GAMUDA BERHAD (5398) 

Observation from Chart:

GAMUDA forming ascending triangle pattern.

Will it break through the strong resistance?

Other indicator:-
MACD trade at positive region, uptrend sign.
Stochastic %K on BUY call itinerary.

Immediate resistance @ RM4.91 level.
Subsequent resistance @ RM5.00 level.

Immediate support @ RM4.81 level.
Subsequent support @ RM4.76 level.

Let's watch closely.

Wednesday, September 14, 2016

Technical Analysis Sept 2016: MITRA (9571)


MITRAJAYA HOLDINGS BERHAD

Observation From Chart:

MITRA is forming higher high & higher low.

How about this round, will it break RM1.45 resistance?

Other indicator:-
MACD trade @ positive region, uptrend sign.
Stochastic %K on SELL call itinerary.

Immediate resistance @ RM1.45 level.
Subsequent resistance @ RM1.50 level.

Immediate support @ RM1.40 level.
Subsequent support RM1.35 level.

Once breakout RM1.45 resistance, higher high is confirm.
Uptrend will resume.

Fundamental Outlook of MITRA
Source: http://www.mitrajaya.com.my/

Let's watch closely.

Sunday, September 11, 2016

Technical Analysis Sept 2016: PRESBHD (5204)


PRESTARIANG BERHAD

Observation from Chart:-

PRESBHD rebound from uptrend support level.

Will it retest the uptrend resistance level which is approx RM3.60 level ?

Other indicator:-
MACD trade at positive region, uptrend sign.
Stochastic %K on BUY call itinerary.

Immediate resistance @ RM2.24 level.
Subsequent resistance @ RM2.33 level.

Immediate support @ RM2.14 level.
Subsequent support @ RM2.08 level.

Let's watch closely.

Wednesday, September 7, 2016

Technical Analysis Sept 2016: BURSA (1818)


BURSA MALAYSIA BERHAD 

Observation from Chart:-

BURSA rebound at support level.

Will it retest the resistance level ?

Other indicator:-
MACD at negative region, it is downtrend itinerary.
Stochastic %K on BUY call itinerary.

Immediate resistance @ RM9.00 level.
Subsequent resistance @ RM9.30 level.

Immediate support @ RM8.70 level.
Subsequent support @ RM8.65 level.

If market sentiment remain bullish momentum, high potential BURSA will retest uptrend resistance level.

Let's watch closely.

 If you like this post, feel free to donate

Tuesday, September 6, 2016

Technical Analysis Sept 2016: MYEG (0138)


MY E.G. SERVICES BHD (0138)

Observation From Chart:-

MYEG succeed breakout RM2.14 resistance level.

Will it retest & breakout next resistance RM2.34 level ?

Other indicator:-
MACD trade at positive region, uptrend sign.
Stochastic %K on BUY call.

Immediate support @ RM2.14 level.
Subsequent support @ RM2.10 level.

Immediate resistance @ RM2.25 level.
Subsequent resistance @ RM2.30 level.

Positive news on MYEG:-
29 August 2016 , MYEG proposed one (1) Bonus Share for every two (2) existing MYEG Shares held on an entitlement date to be determined later ("Proposed Bonus Issue").

For more info, pls refer http://www.bursamalaysia.com/

Based on pass history, bonus issue held on Oct / Dec.

Upcoming budget 2017 & upcoming dividend also potential boost the share price..

Let's watch closely.

Monday, September 5, 2016

Technical Analysis Sept 2016: KRONO (0176)


KRONOLOGI ASIA BERHAD (0176) 

Observation from Chart:

KRONO (0176) succeed formed higher high & higher low

How high will it go?

Other indicator:-
MACD trade at positive region.
Stochastic %K trigger BUY call, pending confirmation.

Immediate resistance @ RM0.24 level.
Subsequent resistance @ RM0.245 level.

Immediate support @ RM0.235 level
Subsequent support @ RM0.23 level.

Let watch closely...

Sunday, September 4, 2016

Technical Analysis Sept 2016: MBSB (1171)


MALAYSIA BUILDING SOCIETY BERHAD 

Observation from Chart:

MBSB succeed formed higher high & higher low

Will it form another higher high?

Other indicator:-
MACD trade at positive region.
Stochastic %K on BUY call itinerary.

If breakout RM0.93 resistance level, another higher high is confirm.

Immediate resistance @ RM0.93 level.
Subsequent resistance @ RM0.955 level.

Immediate support @ RM0.815 level
Subsequent support @ RM0.78 level.

Let watch closely...

Friday, September 2, 2016

Technical Analysis Sept 2016: KAREX (5247)

KAREX BERHAD (5247) 

Observation from Chart:

KAREX (5247) forming triangle pattern.

It manage retest support level & rebound.

Other indicator:-
MACD trade at positive region, uptrend sign.
Stochastic %K on BUY call itinerary.

Immediate resistance @ RM2.45 level.
Subsequent resistance @ RM2.60 level.

Immediate support @ RM2.30 level.
Subsequent support @ triangle support level.

ZIKA news:-
To Prevent Zika, Huge Condom Billboards Going Up in South Florida Source: http://www.browardpalmbeach.com/

Obama’s Zika Advice to America: Use Condoms Properly
Source: http://www.cnsnews.com/

Zika: Condom and gloves sales set to rise
Source: http://www.freemalaysiatoday.com/

Let's watch closely

Wednesday, August 17, 2016

Technical Analysis Aug 2016: GBGAQRS (5226)

GABUNGAN AQRS BERHAD (5226)

Observation from Chart:

GBGAQRS (5226) forming ascending triangle pattern.

Will it breakout RM1.18 resistance level & go higher?

Other indicator:-
MACD trade at positive region, uptrend sign.
Stochastic %K trigger BUY call, pending confirmation.

Immediate resistance @ RM1.18 level.
Subsequent resistance @ RM1.28 level.

Immediate support @ RM1.12 level.
Subsequent support @ ascending triangle support level.

For news pertaining GBGAQRS:-
AQRS to get RM500 mil SUKE subcontract
Source: http://www.theedgeproperty.com.my/

Company do make clarification pertaining that news.
For full info, pls refer www.bursamalaysia.com

Let's watch closely

Saturday, August 13, 2016

Technical Analysis Aug 2016: AAX (5238)

AIRASIA X BERHAD (5238) 

Observation from Chart:

AAX (5238) retest ascending triangle resistance level.

Will it breakout this strong resistance?

Other indicator:-
MACD trade at positive region, uptrend sign.
Stochastic %K on BUY call.

Immediate resistance @ RM0.41 level.
Subsequent resistance @ RM0.49 level.

Immediate support @ MA20 level.
Subsequent support @ MA50 level.

Let's watch closely

Thursday, August 11, 2016

Technical Analysis Aug 2016: DSONIC (5216)


DATASONIC GROUP BERHAD 

Observation from Chart:-

DSONIC (5216) retest RM1.44 resistance.

Will it breakout & go higher ?

Other indicator:-
MACD trade @ positive region, uptrend sign.
Stochastic %K on BUY call itinerary.

Immediate resistance @ RM1.44.
If able breakout, subsequent resistance @ RM1.50 & RM1.55 level.

Immediate support @ RM1.40 level.
Subsequent support @ RM1.35 level.

Insider acquired from the open market @ RM1.405


Let's watch closely.


Tuesday, August 2, 2016

Technical Analysis Aug 2016: HAIO (7668)


HAI-O ENTERPRISE BERHAD

Observation From Chart:

HAIO forming higher high & higher low.

Will it breakout RM2.95 resistance level?

Other indicator:-
MACD trade @ positive region, uptrend sign.
Stochastic %K trigger buy call, pending confirmation.

Immediate resistance @ RM2.95 level.
Subsequent resistance @ RM3.00 level.

Immediate support @ RM2.88 level.
Subsequent support @ RM2.86 level.

HAIO proposed share buy back again.
For more info, refer Bursa Malaysia website.

Source: www.bursamalaysia.com

Let's watch closely.

If you like this post, buy us a cup of Mocha Latte.

Saturday, July 30, 2016

Technical Analysis July 2016: TUNEPRO (5230)


TUNE PROTECT GROUP

Observation from Chart:-

TUNEPRO forming higher high & higher low.

How high will it go?

Other indicator:-
MACD trade positive region, uptrend sign.
Stochastic %K on SELL call itinerary.

Immediate support @ RM1.57 level.
Subsequent support @ RM1.50 level.

Immediate resistance @ RM1.70 level.
Subsequent resistance @ RM1.75 level .

Let's watch closely.

If you like this post, sponsor us a cup of Mocha Latte.


Tuesday, July 19, 2016

Technical Analysis July 2016: DUFU (7233)


DUFU TECHNOLOGY CORP. BHD 

Observation from Chart:-

DUFU forming higher high & higher low.

How high will it go?

Other indicator:-
MACD trade positive region, uptrend sign.
Stochastic %K on SELL call itinerary.

Immediate support @ RM0.645 level.
Subsequent support @ RM0.63 which is around MA20 level.

Immediate resistance @ RM0.68 level.
Subsequent resistance @ RM0.70 level .

Insider been disposed the share @ RM0.66 level
For more info, pls refer BursaMalaysia website.


Let's watch closely.

Technical Analysis July 2016: BJCORP (3395)

BERJAYA CORPORATION BERHAD

Observation from Chart:-

BJCORP forming two kind of pattern.
1. Period of 1 Quarter chart: descending triangle pattern.
2. Period of 1 year chart: bolinger band squeeze pattern (resistance @ RM0.44, support @ RM0.34)

Will it breakout the descending triangle resistance?

Other indicator:-
MACD trade at negative region, downtrend sign.
Stochastic %K on SELL call itinerary.

Immediate resistance @ RM0.37 which is descending triangle line
Subsequent resistance @ RM0.385 level.

Immediate support @ MA20 which is RM0.355 level.
Subsequent support @ RM0.35 level.

From fundamental point of view,
BJCORP succeed launch lottery at Vietnam
Source: http://www.nst.com.my/

Approx next 4months, Digit game will be launch
Source: http://www.chinapress.com.my/

Let's watch closely BJCORP next few quarter report card.

Sunday, July 17, 2016

Technical Analysis July 2016: PADINI (7052)


PADINI HOLDINGS BHD 

Observation from Chart:-

PADINI retest uptrend resistance level.

Will it break the resistance level?

Other indicator:-
MACD trade at positive region, uptrend stock.
Stochastic %K already at overbought stage.

Immediate resistance @ uptrend resistance level.

Immediate support @ RM2.45 level.
Subsequent support @ RM2.36 level.

Let's watch closely.

Saturday, July 16, 2016

Technical Analysis July 2016: MAGNUM (3859)

MAGNUM BERHAD 

Observation from Chart:-

MAGNUM formed double bottom @ RM2.19 level & retest MA200 resistance level (+11%).

Will it breakout & go higher?

Other indicator:-
MACD trade at positive region, uptrend sign.
Stochastic %K on SELL call itinerary.

Due to overbought, most likely it will retrace down or consolidate sideway.
Immediate support @ MA100 which is around RM2.37 level.
Subsequent support @ RM2.33 level.

Immediate resistance @ MA200 level
Subsequent resistance @ RM2.50 level.

Let's watch closely...

Wednesday, July 13, 2016

Technical Analysis July 2016: UOADEV (5200)


UOA DEVELOPMENT BHD 

Observation from chart:-

UOADEV retest RM2.19 resistance level.

Will it breakout & go higher ?

Other indicator:-
MACD trading @ positive region, uptrend sign.
Stochastic %K trigger BUY call.

Immediate resistance @ RM2.19 level.
Immediate support @ RM2.15 level.
Subsequent support @ RM2.13 level.

If breakout RM2.19 resistance, another new high record been form.
It might be kickoff another wave of uptrend.

Let's watch closely.

Technical Analysis July 2016: LKL (0182)


LKL INTERNATIONAL BERHAD (0182) 

Observation From Chart:

LKL consolidate side way.

Will it breakout & go higher?

Other indicator:-
MACD trade @ positive region, uptrend sign.
Stochastic %K @ on buy call itinerary.

Immediate resistance @ RM0.29 level.
Subsequent resistance @ RM0.305 level.

Immediate support @ RM0.28 level.
Subsequent support @ RM0.26 level.

Insider accumulate the share @ RM0.28
Source: http://www.bursamalaysia.com/ 

Let's watch closely.