Tuesday, May 31, 2011

Technical Analysis May 2011: CIMB (1023)


CIMB GROUP HOLDINGS BERHAD

Observation From Chart:


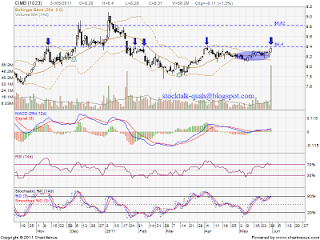
CIMB is trading within tight range swing from RM8.11 to RM8.31 & forming Bolinger Band Squeeze.

As 31 May 2011, CIMB retest RM8.40 strong resistant level.

Before this, it have been attempted a few round unable break up this level BUT retrace down.

How about this round? Will it able break above this level?

If able break up this level with huge volume, it might be retest RM8.82 level high soon.

Let watch closely for entry opportunity.

Remark:
Pls buy at your own risk & consult your broker b4 make any buy or sell order!!!

Sunday, May 29, 2011

Technical Analysis May 2011: KULIM (2003)


KULIM (MALAYSIA) BERHAD


Observation From Chart:


KULIM is trading within tight range swing from RM3.20 to RM3.40 & forming Bolinger Band Squeeze.

RM3.40 is strong resistant level, attempted a few round unable break up this level BUT retrace down.

RM3.20 is strong support level, it do attempted a few round & rebound back.

On Friday, 27 May 2011, Kulim reported their Quarter result.

Kulim’s earnings jumped 105% to RM127.10 million in the first quarter ended March 31, 2011 (1QFY11) from RM61.89 million a year ago.

Its revenue climbed 34% to RM1.657 billion from RM1.234 billion while earnings per share were 10.12 sen compared with 16.40 sen a year ago.

Source:
http://www.theedgemalaysia.com/business/187326-stocks-to-watch-sime-ijm-lag-alam-maritim-ta-ann-kulim.html

With the strong positive Quarter Result, will it break up bolinger band squeeze?

If break up the bolinger band, next resistant would be RM3.97 or RM4.00 physiology level.

Let watch closely for entry opportunity.

Remark:
Pls buy at your own risk & consult your broker b4 make any buy or sell order!!!

Technical Analysis May 2011: MAS (3786)


MALAYSIAN AIRLINE SYSTEM BERHAD

Observation from Chart:

Downtrend stock, forming lower high & lower low.

Since Feb 2011, MACD retrace down to negative region.

Unfortunately, RM1.80 support level unable sustain. It further break down the support.

From stochastics %K indicator, MAS definitely at oversold stage, technical rebound will be in place soon.

Let watch closely...


Remark:
Pls buy at your own risk & consult your broker b4 make any buy or sell order!!!

Thursday, May 26, 2011

Technical Analysis May 2011: IGB (1597)


IGB CORPORATION BERHAD

Observation from Chart:-

Since March 2011, IGB been trade on side way, it keep consolidate within RM2.10 & RM2.18 range.

From the chart, it is very obvious that forming bolinger band squeeze.

Will it break up or break down???

If able break up bolinger band, it is a good opportunity to entry. It will retest RM2.32 level.

However, if break down the bolinger band, next support would be RM2.00 physiology support level.

Let watch closely for entry opportunity...


Remark:
Pls buy at your own risk & consult your broker b4 make any buy or sell order!!!

Sunday, May 22, 2011

Technical Analysis May 2011: WCT (9679)


WCT BERHAD

Observation from Chart:-


As 20 May 2011, WCT retest around RM3.14 resistant level OR MA100 resistant level.

If able break above this level, it might retest next resistant level which is RM3.23 & RM3.29

However, if retrace down, next support would be RM3.02 & RM2.94 support level.

RM2.94 may define as strong support level, a few round it were rebound from this strong support.

Will it break up RM3.14 level or retest RM2.94 support level?
Let watch closely...


Remark:
Pls buy at your own risk & consult your broker b4 make any buy or sell order!!!

Technical Analysis May 2011: BIMB (5258)


BIMB HOLDINGS BERHAD

Observation From Chart:-

BIMB retest RM1.68 resistant again.

If able break up the this level, it will create higher high, uptrend will be continue.

Most analysts will take a position once the price breaks through RM1.68 with increased volume.

However, if retrace down, it might retest MA50, RM1.54 level.
Or future retrace down to MA100, RM1.49 support level.

Let watch closely for entry opportunity.

Remark:
Pls buy at your own risk & consult your broker b4 make any buy or sell order!!!

Thursday, May 19, 2011

Technical Analysis May 2011: TAANN (5012)


TA ANN HOLDINGS BERHAD

Observation From Chart:-


TAANN seem like forming symmetrical triangle.

If able break up the triangle, it will create higher high, uptrend will be continue.

Most analysts will take a position once the price breaks through the top line of the triangle with increased volume.

Stochastic %K been trigger buy call on 19 May 2011.
MACD trade above positive region & going bullish crossover soon.

What do you think?
Will it breaks through the top line?
Let watch closely.

Remark:
Pls buy at your own risk & consult your broker b4 make any buy or sell order!!!

Tuesday, May 17, 2011

Technical Analysis May 2011: TWSPLNT (6327)


TRADEWINDS PLANTATION BERHAD

Observation from Chart:

On 15 May 211, TWSPLNT break up RM3.30 resistant level with huge volume.
Current resistant is RM3.46 level.

If break up RM3.46, subsequent resistant would be RM3.62 level.

However, if retrace down, it might retest RM3.30 level.

MACD remain at positive region, in progress of bullish crossover,

Stochastic %K NO trigger any sell call.


Let watch closely...


Remark:
Pls buy at your own risk & consult your broker b4 make any buy or sell order!!!

Monday, May 16, 2011

Technical Analysis May 2011: LIONIND (4235)


LION INDUSTRIES CORPORATION BERHAD

Observation from Chart:


LIONIND rebound from RM1.59 support level.

Next resistant would be MA100 RM1.84 level.

If retrace down, it might retest RM1.59 level.

MACD formed bullish crossover BUT not yet pass through positive region.

If able pass through positive region, it will be a buy call on this counter.

Let watch closely...


Remark:
Pls buy at your own risk & consult your broker b4 make any buy or sell order!!!

Sunday, May 15, 2011

Technical Analysis May 2011: DRBHCOM (1619)


DRB-HICOM BERHAD

Observation from Chart:-

On 13 May 2011, DRBHCOM break up RM2.24 resistant with high volume.

MACD indicator formed bullish crossover.
Most probably it will retest RM2.48 high soon.

However, if retrace down, it might retest RM2.24 support.
Subsequent support would be MA50 RM2.18 or MA100 RM2.09 level.

Let watch closely.


Remark:
Pls buy at your own risk & consult your broker b4 make any buy or sell order!!!

Saturday, May 14, 2011

Technical Analysis May 2011: Axiata (6888)


AXIATA GROUP BERHAD

Observation from Chart:-

From the chart, AXIATA (6888) is continue uptrend.

No reversal candlestick been formed.
MACD indicator at positive region
Added, Stochastic %K NO trigger sell call.

Next resistant should be RM5.16 level, it will retest this level soon.

If retraced down, most probably will retest RM4.95 support level.
Subsequent support would be RM4.90 level.

Let watch closely.

Remark:
Pls buy at your own risk & consult your broker b4 make any buy or sell order!!!

Thursday, May 12, 2011

Technical Analysis May 2011: KFC (3492)


KFC HOLDINGS (MALAYSIA) BERHAD

Observation from Chart:

On 12 May 2011, KFC successful break up bolinger band squeeze.
Current resistant which is around RM3.85 level

Subsequent resistant would be RM4.10 level.

Let watch closely.

Remark:
Pls buy at your own risk & consult your broker b4 make any buy or sell order!!!

Tuesday, May 10, 2011

Technical Analysis May 2011: KINSTEL (5060)


KINSTEEL BERHAD

Observation from Chart:-


KINSTEEL is forming decending triangle.

As today, 10 May 2011 reversal candlestick been formed at RM0.79 support level.

MACD histrogram indicator been turn GREEN color.

Stochastic %K do trigger a buy call.

May predict it might retest upper line of triangle (strong resistant).

However, if retrace down, it will retest strong support which is RM0.79 level.

Let watch closely...


Remark:
Pls buy at your own risk & consult your broker b4 make any buy or sell order!!!


Monday, May 9, 2011

Technical Analysis May 2011: DIALOG (7277)


DIALOG GROUP BERHAD

Observation from Chart:-

DIALOG still an uptrend stock, MACD at positive region.
Current resistant RM2.56 if able break above this level with huge volume, it is a good entry opportunity.

If retrace down, it might retest next support level, RM2.36 which also MA50 support level.
Subsequent support level would be RM2.19 or MA100 level.

Let watch closely...

Remark:
Pls buy at your own risk & consult your broker b4 make any buy or sell order!!!

Sunday, May 8, 2011

Technical Analysis May 2011: NAIM (5073)


NAIM HOLDINGS BERHAD

Observation from Chart:-

NAIM have been retrace from 52WW high RM3.82 to RM2.61 level. ( -RM1.21 or -31.5%)


Currently, it is oversold stage, will have a technical rebound soon.
RM2.61 is current support level.

If there is reversal candlestick been form, it might be an opportunity to entry.
It might rebound & retest RM2.81 resistant level.


However, if future retrace down, next support would be RM2.30 level.


Let watch closely.


Remark:
Pls buy at your own risk & consult your broker b4 make any buy or sell order!!!

Technical Analysis May 2011: OSK (5053)


OSK HOLDINGS BERHAD

Observation from Chart:-

Since 22 March, OSK trade between RM1.65 & RM1.78 range & now forming bolinger band squeeze.


Current resistant RM1.78 & current support RM1.65 level.


If break up the bolinger band squeeze, it might retest RM1.92 resistant level.


If break down the lower band support, next support which is around RM1.54 level.

6 May 2011, MACD formed bullish crossover BUT volume is too low.

Added, Stochastic %K pending trigger for buy call.

Let watch closely.

Remark:
Pls buy at your own risk & consult your broker b4 make any buy or sell order!!!

Monday, May 2, 2011

Technical Analysis May 2011: GENTING (3182)


GENTING BERHAD

Observation from Chart:-

As 29 April 2011, GENTING closed at RM11.60 level.

Will it retest RM11.97 level or retrace down?

From candlestick view, it formed Bearish Engulfing Pattern
High probability it will retrace down to RM11.25 support level or RM11.12 level.

If there is reversal candlestick been form, it might be an opportunity to entry.
It will retest RM11.97 level.

Let watch closely.


Remark:
Pls buy at your own risk & consult your broker b4 make any buy or sell order!!!

Sunday, May 1, 2011

Technical Analysis May 2011: GPACKET (0082)


GREEN PACKET BERHAD

Observation from Chart:-

GPACKET (0082) currently trade at strong support level RM0.61

If rebound + break up MA50 resistant level, most probably will retest RM0.68 level.
If the rebound strong, might retest next level of resistant which is MA100, RM0.71 level.

29 April 2011, GPACKET formed doji candlestick pattern at bolinger middle band.
Added, MACD indicator & Stochastic %K NO trigger sell call.

Let watch closely for opportunity.

Remark:
Pls buy at your own risk & consult your broker b4 make any buy or sell order!!!