Wednesday, March 29, 2017

Technical Analysis Mar 2017: YTLPOWR (6742)


YTL POWER INTERNATIONAL BHD

Observation from Chart:-

YTLPOWER forming ascending triangle pattern?

Will breakout RM1.54 resistance & go higher?

Other indicator:-
MACD at positive region, uptrend sign.
Stochastic %K on BUY call itinerary.

Immediate resistance @ RM1.54 level
Subsequent resistance @ RM1.57 level.

Immediate support @ RM1.50 level.
Subsequent support @ RM1.47 level.

If able breakout RM1.54, higher is confirm. Uptrend will resume.

Let's watch closely.

Tuesday, March 28, 2017

Technical Analysis Mar 2017: TEOSENG (7252)


TEO SENG CAPITAL BERHAD 

Observation from Chart:-

TEOSENG (7252) retest strong support level.

Will it rebound?

Other indicator:-
MACD trade at negative region, downtrend sign.
Stochastic %K trigger buy call, pending confirmation.

Immediate support @ RM1.06 level.
Subsequent support @ RM1.01 level.

Immediate resistance @ RM1.13 level
Subsequent resistance @ RM1.20 level.

Let's watch closely.

Technical Analysis Mar 2017: ANZO (9342)


ANZO HOLDINGS BERHAD 

Observation from Chart:-

ANZO (9342) breakout bolinger band squeeze & bull run 100% ++

Will it take a rest & retrace down?

Other indicator:-
MACD trade at positive region, uptrend sign.
Stochastic %K at overbought stage.

Immediate support @ RM0.45 level.
Subsequent support @ RM0.37 level.

Immediate resistance @ RM0.625 level

Insider acquisition of shares via open market, from Dec 2016 till Jan 2017.

For more info, pls refer Bursa Malaysia

Let's watch closely.

Monday, March 27, 2017

Technical Analysis Mar 2017: L&G (3174)


LAND & GENERAL BHD (3174) 

Observation from Chart:-

L&G (3174) facing strong resistance @ RM0.355 & retrace down

Will it rebound @ RM0.32 support level?

Other indicator:-
MACD moving toward negative region, downtrend sign.
Stochastic %K on SELL call itinerary.

Immediate support @ RM0.32 level.
Subsequent support @ RM0.29 level.

Immediate resistance @ RM0.355 level
Subsequent resistance @ RM0.375 level.

Based on pass hisotry, L&G do announced RM0.02  final dividend on July / August

Let's watch closely.

Sunday, March 26, 2017

Technical Analysis Mar 2017: TAGB (5158)


TA GLOBAL BERHAD

Observation from Chart:-

TAGB (5158) forming higher high & higher low.

How high will it go?

Other indicator:-
MACD moving toward positive region, uptrend sign.
Stochastic %K on SELL call itinerary.

Immediate support @ RM0.365 level.
Subsequent support @ RM0.34 level.

Immediate resistance @ RM0.39 level
Subsequent resistance @ RM0.42 level.

Insider keep acquisition of shares via open market. Jan till March 2017, the share price keep moving up, insider still keep on acquisition the share through open market.

For more info, pls refer Bursa Malaysia


Let's watch closely.

Saturday, March 25, 2017

Technical Analysis Mar 2017:TAKAFUL (6139)


SYARIKAT TAKAFUL MALAYSIA BHD 

Observation from Chart:-

TAKAFUL (6139) succeed breakout ascending triangle resistance?

How high will it go?

Other indicator:-
MACD moving toward positive region, uptrend sign.
Stochastic %K on buy call itinerary.

Immediate support @ RM4.05 level.
Subsequent support @ RM3.93 level.

Immediate resistance @ RM4.17 level
Subsequent resistance @ RM4.22 level.

Let's watch closely.

Technical Analysis Mar 2017: OSK (5053)


OSK HOLDINGS BERHAD 

Observation from Chart:-

OSK (5053) forming bolinger band squeeze within RM1.55 to RM1.58 range.

Will it breakout & go higher?

Other indicator:-
MACD trade at positive region, uptrend sign.
Stochastic %K on SELL call itinerary.

Immediate support @ RM1.55 level.
Subsequent support @ RM1.50 level.

Immediate resistance @ RM1.58 level
Subsequent resistance @ RM1.61 level.

Final dividend RM0.05 which will be ex-date on 20 Apr 2017

Let's watch closely.

Thursday, March 23, 2017

Technical Analysis Mar 2017: WELLCAL (7231)


WELLCALL HOLDINGS BHD 

Observation from Chart:

WELLCAL forming non stop higher high

Will it retrace down to retest support level?

Other indicator:-
MACD at positive region, uptrend sign.
Stochastic %K already reach overbought stage.

Most probably correction / consolidate will be in place soon.

Immediate support @ RM2.11 level.
Subsequent support @ RM2.05 level.

Let's watch closely...

Technical Analysis Mar 2017: KRONO (0176)


KRONOLOGI ASIA BERHAD (0176) 

Observation from Chart:

KRONO (0176) forming bolinger band squeeze.

When will it breakout the band?

Other indicator:-
MACD trade at positive region, uptrend sign.
Stochastic %K trigger BUY call, pending confirmation.

Immediate resistance @ RM0.385 level.
Subsequent resistance @ RM0.41 level.

Immediate support @ RM0.35 level
Subsequent support @ RM0.32 level.

Let's watch closely...

Wednesday, March 22, 2017

Technical Analysis Mar 2017: EFFICEN (0064)


EFFICIENT E-SOLUTIONS BHD 

Observation from Chart:-

EFFICEN forming higher high?

Will it form a higher low?

Other indicator:-
MACD trade at positive region, uptrend sign.
Stochastic %K on SELL call itinerary.

Immediate resistance @ RM0.295 level.
Subsequent resistance @ RM0.305 level.

Immediate support @ RM0.275 level.
Subsequent suport @ RM0.26 level.

If able form a higher low, means uptrend is confirm.

Let's watch closely.

Technical Analysis Mar 2017: NOTION (0083)


NOTION VTEC BERHAD

Observation from Chart:-

NOTION (0083) non stop bull run since 3 Jan 2017
(Less than 3months period, share price 200% gain)

Will it retrace down to retest support level?

Other indicator:-
MACD trade at positive region, uptrend sign.
Stochastic %K trigger SELL call, pending confirmation.

Immediate resistance @ RM1.32 level.
Subsequent resistance @ RM1.455 level.

Immediate support @ RM1.25 level.
Subsequent support @ RM1.16 level.

Let's watch closely.

Tuesday, March 21, 2017

Technical Analysis Mar 2017: WASEONG (5142)


WAH SEONG CORPORATION BERHAD 

Observation from Chart:-

WASEONG (5142) forming symmetrical triangle pattern.

Will it break up or down?

Other indicator:-
MACD trade at positive region, uptrend sign.
Stochastic %K on BUY call itinerary.

Immediate resistance @ RM0.88 level.
Subsequent resistance @ RM0.905 level.

Immediate support @ RM0.86 level.
Subsequent support @ RM0.82 level.

If break up, potential retest RM0.98 level.
If break down, potential retest RM0.74 level.

Let's watch closely.

Monday, March 20, 2017

Technical Analysis Mar 2017: WTK (4243)


WTK HOLDINGS BERHAD

Observation from Chart:-

Since 23 Nov 2016, WTK (4243) forming bolinger band squeeze .

When will it breakout ?

Other indicator:-
MACD trade at negative region, downtrend sign.
Stochastic %K on BUY call itinerary.

Immediate resistance @ RM1.05 level.
Subsequent resistance @ RM1.12 level.

Immediate support @ RM0.98 level.
Subsequent support @ RM0.895 level.

Let's watch closely.

Technical Analysis Mar 2017: UCHITEC (7100)


UCHI TECHNOLOGIES BERHAD

Observation from Chart:

UCHITEC (7100) forming bolinger band squeeze. (squeeze @ RM1.75 to RM1.85 range)

When will it breakout?

Other indicator:-
MACD trade at positive region, uptrend sign.
Stochastic %K trigger BUY call, pending confirmation.

Immediate resistance @ RM1.85 level.

Immediate support @ RM1.75 level.
Subsequent support @ RM1.69 level.

Referring the Q4 annual report, there is 8cent final dividend.
Based on pass history, UCHITEC will announce their final dividend on April.


Let's watch closely...

Sunday, March 19, 2017

Technical Analysis Mar 2017: NWP (5025)


NWP HOLDINGS BERHAD 

Observation from Chart:

NWP (5025) succeed breakout bolinger band squeeze. (Almost 5months squeeze @ RM0.195 to RM0.25 range)

How high will it go?

Other indicator:-
MACD trade at positive region, uptrend sign.
Stochastic %K on BUY call itinerary.

Immediate resistance @ RM0.27 level.
Subsequent resistance @ RM0.28 level.

Immediate support @ RM0.25 level.
Subsequent support @ RM0.225 level.

Let's watch closely...

Technical Analysis Mar 2017: BAHVEST (0098)


BORNEO AQUA HARVEST BHD 

Observation from Chart:

BAHVEST (0098) forming descending triangle pattern.

Will it breakout downtrend resistance line?

Other indicator:-
MACD trade at negative region, downtrend sign.
Stochastic %K on BUY call itinerary.

If breakout descending triangle line,
Immediate resistance @ RM0.85 level.
Subsequent resistance @ RM0.87 level.

Immediate support @ RM0.815 level.
Subsequent support @ RM0.775 level.

Let's watch closely...

Thursday, March 16, 2017

Technical Analysis Mar 2017: IRIS (0010)


IRIS CORPORATION BHD 

Observation from Chart:-

IRIS (0010) succeed breakout RM0.145 resistance level.

How high will it go?

Other indicator:-
MACD at positive region, uptrend itinerary.
Stochastic %K on BUY call itinerary.

Immediate resistance @ RM0.15 level.
Subsequent resistance @ RM0.18 level.

Immediate support @ RM0.145 level.
Subsequent support @ RM0.135 level.

Let's watch closely.

Wednesday, March 15, 2017

Technical Analysis Mar 2017: HARTA (5168)


HARTALEGA HOLDINGS BERHAD

Observation from Chart:

HARTA (5168) forming bolinger band squeeze since Oct 2016.

When will it breakout?

Other indicator:-
MACD trade at positive region, uptrend sign.
Stochastic %K on SELL call itinerary.

Immediate support @ RM4.54 level.
Subsequent support @ RM4.40 level.

Immediate resistance @ RM5.00 level
Subsequent resistance @ RM5.13 level.

Let's watch closely for opportunity.

Technical Analysis Mar 2017: HAPSENG (3034)


HAP SENG CONSOLIDATED BERHAD 

Observation from Chart:-

HAPSENG forming ascending triangle pattern.

Will it breakout the resistance?

Other indicator:-
MACD trade at positive region, uptrend itinerary.
Stochastic %K on BUY call itinerary.

If able breakout RM9.20 another new high record been form.

If retrace down,
Immediate support @ RM9.00 level.
Subsequent support @ RM8.90 level.

Let's watch closely for opportunity.

Tuesday, March 14, 2017

Technical Analysis Mar 2017: BJTOTO (1562)


BERJAYA SPORTS TOTO BERHAD 

Observation from Chart:-

BJTOTO forming bolinger band squeeze

When will it breakout ?

Other indicator:-
MACD trade @ negative region, downtrend sign.
Stochastic %K @ on buy call itinerary.

Immediate support @ RM3.00 level.
Subsequent support @ RM3.05 level.

Immediate resistance @ RM2.88 level.
Subsequent resistance @ RM2.80 level.

Upcoming quarter result & dividend will be announce soon.

Let's watch closely.

Monday, March 13, 2017

Technical Analysis Mar 2017: TAANN (5012)


TA ANN HOLDINGS BERHAD 

Observation From Chart:-

TAANN retest RM3.64 support level.

Will it rebound ?

Other indicator:-
MACD trade at negative region, downtrend itinerary.
Stochastic %K NO trigger BUY call yet.

Immediate resistance @ downtrend line.
Subsequent resistance @ RM3.84 level.

Immediate support @ RM3.64 level.
Subsequent support @ RM3.43 level.

Let's watch closely.

Sunday, March 12, 2017

Technical Analysis Mar 2017: WCT (9679)


WCT BERHAD 

Observation from Chart:-

WCT forming symmetrical triangle pattern.

Will it break up or down?

Other indicator:-
MACD trade at positive region, uptrend itinerary.
Stochastic %K trigger SELL call, pending confirmation.

Immediate support @ RM1.80 level.
Subsequent support @ RM1.725 level.

Immediate resistance @ RM1.92 level
Subsequent resistance @ RM1.98 level.

Let's watch closely...

Saturday, March 11, 2017

Technical Analysis Mar 2017: BJCORP (3395)


BERJAYA CORPORATION BERHAD 

Observation from Chart:-

BJCORP forming symmetrical triangle pattern.

Will it break up or down?

Other indicator:-
MACD trade at positive region, uptrend sign.
Stochastic %K on SELL call itinerary.

Immediate resistance @ RM0.405 level.
Immediate support @ RM0.37 level.

If break up, potential retest RM0.445 level.
If break down, potential retest RM0.355 level.

Most likely it will choose direction on upcoming quarter result.
According pass history, the quarter result will be released on final week of March.

Let's watch closely.

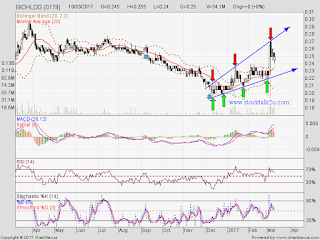
Technical Analysis Mar 2017: BIOHLDG (0179)


BIOALPHA HOLDINGS BERHAD 

Observation from Chart:-

BIOHLDG (0179) forming higher high & higher low.

How about this round, will it retest support level & rebound again?

Other indicator:-
MACD trade at positive region, uptrend sign.
Stochastic %K remain on BUY call itinerary.

Immediate resistance @ RM0.255 level.
Subsequent resistance @ RM0.275 level.

Immediate support @ RM0.235 level.
Subsequent support @ RM0.225 level.

Last year insider keep acquisition of shares via open market.
Jan till March 2017, the share price keep moving up, insider keep on disposed the share through open market.


For detail info, pls refer Bursa Malaysia website.

Let's watch closely.

Technical Analysis Mar 2017: BENALEC (5190)


BENALEC HOLDINGS BERHAD 

Observation from Chart:-

BENALEC forming higher high & higher low. 

How high will it go?

Other indicator:-
MACD trade at positive region, uptrend sign.
Stochastic %K remain on BUY call itinerary.

Immediate resistance @ RM0.65 level.
Subsequent resistance @ RM0.74 level.

Immediate support @ RM0.46 level.
Subsequent support @ RM0.40 level.

Let's watch closely.

Thursday, March 9, 2017

Technical Analysis Mar 2017: GADANG (9261)


GADANG HOLDINGS BHD (9261) 

Observation from Chart:-

GADANG (9261) succeed breakout uptrend resistance level.

How high will it go ?

Other indicator:-
MACD trade at positive region, uptrend sign.
Stochastic %K trigger BUY call, pending confirmation.

Immediate support @ RM1.15 level.
Subsequent support @ RM1.12 level.

Immediate resistance @ RM1.28 level.
Once break this resistance, no major resistance.

Let's watch closely

Wednesday, March 8, 2017

Technical Analysis Mar 2017: PRESTAR (9873)


PRESTAR RESOURCES BERHAD

Observation from Chart:-

PRESTAR (9873) forming descending triangle pattern.

Will it rebound at support level & breakout descending line resistance ?

Other indicator:-
MACD trade at negative region, downtrend sign.
Stochastic %K pending trigger BUY call.

Immediate support @ RM0.855 level.
Subsequent support @ RM0.79 level.

Immediate resistance @ descending triangle line resistance.
Subsequent resistance @ RM0.945 level.

Let's watch closely.

Tuesday, March 7, 2017

Technical Analysis Mar 2017: UEMS (5148)


UEM SUNRISE BERHAD 

Observation from Chart:-

UEMS forming higher high & higher low.

Today bullish momentum succeed breakout upper resistance line.

Other indicator:-
MACD trade at positive region, uptrend sign.
Stochastic %K on BUY call itinerary.

Immediate support @ RM1.18 level.
Subsequent support @ RM1.12 level.

Immediate resistance @ RM1.23 level.
Subsequent resistance @ RM1.35 level.

Let's watch closely.

Technical Analysis Mar 2017: GENM (4715)


GENTING MALAYSIA BERHAD 

Observation from Chart:

GENM forming higher high & higher low...

How high will it go?

Other indicator:-
MACD at positive region, uptrend sign.
Stochastic %K on BUY call.

Immediate support @ RM5.20 level.
Subsequent support @ RM5.07 level.

Immediate resistance @ RM5.50 level.
Subsequent resistance @ RM6.00 psychology level.

Let's watch closely...

Technical Analysis Mar 2017: GAMUDA (5398)


GAMUDA BERHAD (5398) 

Observation from Chart:

GAMUDA forming ascending triangle pattern?

How high will it go?

Other indicator:-
MACD trade at positive region, uptrend sign.
Stochastic %K on BUY call itinerary.

Immediate resistance @ RM5.00 level.
Subsequent resistance @ RM5.07 level.

Immediate support @ RM4.81 level.
Subsequent support @ RM4.69 level.

Let's watch closely.

Technical Analysis Mar 2017: BAUTO (5248)


BERMAZ AUTO BERHAD

Observation from Chart:-

BAUTO forming descending triangle pattern.

Will it rebound from support level?

Other indicator:-
MACD trade at negative region, downtrend sign.
Stochastic %K on SELL call itinerary.

Immediate resistance @ RM2.07 level.
Subsequent resistance @ RM2.12 level.

Immediate support @ RM2.01 level.
Subsequent support @ RM1.98 level. 

From historical, BAUTO every quarter also distribute dividend

.
Let's watch closely. 

Monday, March 6, 2017

Technical Analysis Mar 2017: DELEUM (5132)


DELEUM BERHAD 

Observation from Chart:-

DELEUM forming bolinger band squeeze.

When will it breakout the band?

Other indicator:-
MACD trade at positive region, uptrend sign.
Stochastic %K on BUY call itinerary.

Immediate resistance @ RM1.065 level.
Subsequent resistance @ RM1.16 level.

Immediate support @ RM0.99 level.
Subsequent support @ RM0.95 level.

Upcoming Dividend ex-date 13 March 2017

Let's watch closely.

Technical Analysis Mar 2017: GHLSYS (0021)


GHL SYSTEMS BHD 

Observation from Chart:-

GHLSYS (0021) forming higher high & higher low.

Will it retest RM1.25 resistance level again ?

Other indicator:-
MACD trade at positive region, uptrend stock.
Stochastic %K on BUY call.

Immediate support @ RM0.975 level.
Subsequent support @ RM0.96 level.

Immediate resistance @ RM1.19 level.
Subsequent resistance @ RM1.25 level.

Let's watch closely.

Technical Analysis Mar 2017: GBGAQRS (5226)


GABUNGAN AQRS BERHAD (5226) 

Observation from Chart:

GBGAQRS (5226) forming higher low.

Will it forming higher high?

Other indicator:-
MACD trade at positive region, uptrend sign.
Stochastic %K on BUY call itinerary.

Immediate resistance @ RM1.09 level.
Subsequent resistance @ RM1.12 level.

Immediate support, ascending triangle level.
Subsequent support @ RM0.96 level.

Let's watch closely.

Sunday, March 5, 2017

Technical Analysis Mar 2017: YTL (4677)


YTL CORPORATION BERHAD 

Observation from Chart:-

YTL forming bolinger band squeeze.

When will it breakout bolinger band squeeze?

Other indicator:-
MACD moving toward negative region, downtrend sign.
Stochastic %K pending trigger BUY call.

Immediate resistance @ RM1.56 level.
Subsequent resistance @ RM1.60 level.

Immediate support @ RM1.52 level.
Subsequent support @ RM1.44 level.

Let's watch closely.

Technical Analysis Mar 2017: WILLOW (0008)


WILLOWGLEN MSC BHD 

Observation from Chart:

WILLOW (0008) forming higher high & higher low.

Will it retrace down to retest support level?

Other indicator:-
MACD trade at positive region, uptrend sign.
Stochastic %K on SELL call itinerary.

Immediate resistance @ RM0.85
Subsequent resistance @ RM0.87

Immediate support @ RM0.80 level.
Subsequent support @ RM0.785 level.

Let's watch closely.

Thursday, March 2, 2017

Technical Analysis Mar 2017: VITROX (0097)


VITROX CORPORATION BERHAD 

Observation From Chart:-

VITROX succeed breakout triangle resistance.

How high will it go ?

Other indicator:-
MACD trade at positive region, uptrend sign.
Stochastic %K trigger BUY call again.

Immediate support @ RM4.00 level.
Subsequent support @ RM3.95 level.

No immediate resistance,.
Higher high is confirmed, uptrend will resume.
Due to overbought stage, potential pull back retest support or sideway consolidate soon.

Let's watch closely.

Wednesday, March 1, 2017

Technical Analysis Mar 2017: MYEG (0138)


MY E.G. SERVICES BHD (0138) 

Observation From Chart:-

MYEG succeed breakout ascending triangle pattern.

How high will it go ?

Other indicator:-
MACD trade at positive region, uptrend sign.
Stochastic %K on BUY call itinerary.

Immediate support @ RM1.58 level.
Subsequent support @ RM1.55 level.

No immediate resistance,.
Higher high is confirmed,uptrend might resume.

Let's watch closely.

Technical Analysis Mar 2017: EFORCE (0065)


EXCEL FORCE MSC BHD (0065) 

Observation from Chart:

EFORCE (0065) forming higher high & higher low.

Will rebound at support level?

Other indicator:-
MACD trade at positive region, uptrend sign.
Stochastic %K on SELL call itinerary.

Immediate resistance @ RM1.58 level.
Subsequent resistance @ RM1.68 level.

Immediate support @ RM1.41 level.
Subsequent support @ RM1.33 level.

Let's watch closely.

Technical Analysis Mar 2017: WPRTS (5246)


WESTPORTS HOLDINGS BERHAD

Observation From Chart:-

WPRTS (5246) break the band support level.

How low will it go?

Other indicator:-
MACD trading at negative region, downtrend sign.
Stochastic %K on BUY call itinerary.

Immediate support @ RM3.87 level,
Subsequent support @ RM3.76 level.

Immediate resistance @ RM4.03 level.
Subsequent resistance @ RM4.11 level.

If able breakout upper band resistance which is approx RM4.28 level, then will be more upsize.
If the rebound forming lower high & lower low, then more downsize is coming.

Let's watch closely.