Monday, July 30, 2012

Technical Analysis July 2012: UMCCA (2593)


UNITED MALACCA BHD

Observation from Chart:-

UMCCA (2593) is trading above MA20 support level.

Will it break through RM7.69 resistance level?

Other indicator:-
1. MACD trade at positive region, uptrend sign.
2. Stochastic %K pending trigger BUY call.

Immediate resistance RM7.69 level.
Immmediate support MA20 level.


In view of insider keep acquired in huge volume,high potential break through RM7.69 resistance level & go higher.

Let's watch closely.

Sunday, July 29, 2012

Technical Analysis July 2012: DIALOG (7277)


DIALOG GROUP BERHAD

Observation from Chart:-

DIALOG is forming bolinger band squeeze within RM2.33 & RM2.46 level.

When will it break through the band?

Other indicator:-
1. MACD moving toward positive region, uptrend sign.
2. Stochastic %K still on SELL call itinerary.

Immediate resistance MA20 level.
Strong resistance RM2.46 level.
Immmediate support RM2.33 level.

If the bull strong enough, potential break through RM2.46 resistance level.

Let's watch closely.

Thursday, July 26, 2012

Technical Analysis July 2012: SUNWAY (5211)


SUNWAY HOLDING BERHAD

Observation from chart:-

SUNWAY is retest RM2.25 support level.

Will it rebound? Or break down the support?

Other indicator:-
MACD trade at negative region, downtrend sign.
Stochastic %K still on SELL call.

Immediate resistant would be RM2.32 level.
Immediate support would be RM2.25 level.

If break down bollinger band squeeze, potential facing high selling pressure.

Let's watch closely.

Tuesday, July 24, 2012

Technical Analysis July 2012: UEM LAND (5148)


UEM LAND HOLDINGS BERHAD

Observation from Chart:-

UEMLAND break down MA20 support level.

How low will it go?

Other indicator:-
MACD trade at positive region, uptrend sign.
Stochastic %K on SELL call position.

Technically, it will retest RM2.00 psychology support level.
If NO technical rebound, subsequence support RM1.92 level.
If rebound, immediate resistance @ MA50 level.

Let's watch closely.

Monday, July 23, 2012

Technical Analysis July 2012: SEG (9792)


SEG INTERNATIONAL BHD

Observation from Chart:-

SEG is retrace from RM2.15 high.

What's the immediate support?

Other indicator:-
MACD trade at positive region, uptrend sign.
Stochastic %K still on SELL call itinerary.

Immediate support would be RM2 psychology level.
Subsequent support would be MA20 level.

If rebound, it might retest RM2.15 high again.

Let's watch closely.

Sunday, July 22, 2012

Technical Analysis July 2012: AIRASIA (5099)


AIRASIA BERHAD

Observation from Chart:

AIRASIA is trading sideway.

Will it break through RM3.82 level?

Other indicator:-
MACD trade at positive region, uptrend sign.
Stochastic %K still on SELL call itinerary.

If able break through RM3.82, it will be formed another higher high.

Immediate support @ MA20 level.

Let's watch closely.

Technical Analysis July 2012: BENALEC (5190)


BENALEC HOLDINGS BERHAD

Observation from Chart:-

BENALEC forming bolinger band squeeze within RM1.12 to RM1.20 level.

When will it break through?

Other indicator:-
MACD indicator trade at negative region, downtrend sign.
Stochastic %K already trigger BUY call.

Immediate resistance RM1.20 level.
Immediate support MA20 level.
Subsequent support RM1.12 level.

Let's watch closely.

Thursday, July 19, 2012

Technical Analysis July 2012: PERISAI (0047)


PERISAI PETROLEUM TEKNOLOGI BHD

Observation from Chart:-

PERISAI succeed break through bolinger band squeeze.

How high will it go?

Other indicator:-
MACD at positive region, uptrend sign.
Stochastic %K trigger BUY call, pending confirmation.

High potential will retest RM1.00 psychology level.

If the bull strong enough, potential break through & go higher.

If retrace down, immediate support @ MA20 / MA50 level.

Let's watch closely.

Tuesday, July 17, 2012

Technical Analysis July 2012: SKPETRO (5218)


SapuraKencana Petroleum Berhad (5218)

Observation from Chart:

SKPETRO retest RM2.30 level again.

Will it break through RM2.30 strong resistance?

Other indicator:-
MACD trade at positive region, uptrend sign.
Stochastic %K still on BUY call.

High probably, it may break through RM3.55 resistance level & go higher.
MA20 / MA50 would be the immediate support.

Let's watch closely.

Monday, July 16, 2012

Technical Analysis July 2012: GAMUDA (5398)


Gamuda Berhad (5398)

Observation from Chart:

GAMUDA retest RM3.55 level again.

Will it break through RM3.55 strong resistance?

Other indicator:-
MACD trade at positive region, uptrend sign.
Stochastic %K still on BUY call.

High probably, it may break through RM3.55 resistance level & go higher.
MA20 would be the immediate support.
Subsequent support would be lower triangle line.

Let's watch closely.

Technical Analysis July 2012: MAXIS (6012)


MAXIS BERHAD

Observation from Chart:-

13 July 2012, MAXIS retest RM6.55 resistance level.
Will it break through this resistance?

Other indicator:-
1. MACD trade at positive region, uptrend sign.
3. Stochastic %K still on BUY call.

For a confirm uptrend, it must have higher high & higher low.
In order for MAXIS formed another uptrend wave, it must break through RM6.55 level.

If retrace down, MA20 / MA50 will be the immediate support.
It might be an opportunity to acquire.

Let's watch closely...

Technical Analysis July 2012: HSPLANT (5138)


HAP SENG PLANTATIONS HOLDINGS

Observation from Chart:-

HSPLANT (5138) retest RM3.10 strong resistance level again.

How about this round, will it break through?

Other indicator:-
MACD trade at positive region, uptrend stock.
Stochastic %K at overbought stage, potential consolidate before go higher.

If market sentiment is bullish, high potential it will break through strong resistance, RM2.80 level.

Else, tt will retrace down, retest Immediate support @ RM3 psychology level 1st.

Let's watch closely.

Sunday, July 15, 2012

Technical Analysis July 2012: MUDAJAYA (5085)


MUDAJAYA GROUP BERHAD

Observation from Chart:-

MUDAJAYA still consolidate side way, forming bolinger band squeeze.

When will it break through?

Other indicator:-
MACD trade at positive region, uptrend stock.
Stochastic %K pending trigger BUY call.

If market sentiment is bullish, high potential it will break through strong resistance, RM2.80 level.

Else, tt will keep consolidate above MA20 support level.

Subsequent support @ MA50 level.

Let's watch closely.

Friday, July 13, 2012

Technical Analysis July 2012: HAPSENG (3034)


HAP SENG CONSOLIDATED BERHAD

Observation from Chart:-

HAPSENG is forming ascending triangle.

Will it break through RM1.80 strong resistance?

Other indicator:-
MACD trade at positive region, uptrend itinerary.
Stochastic %K already trigger BUY call.

If able break through RM1.80 level, it will create new higher high.
Immediate support @ MA20 level / lower triangle support.

Let's watch closely.

Wednesday, July 11, 2012

Technical Analysis July 2012: KSK (5097)


KURNIA ASIA BHD

Observation from Chart:

KSK succeed break through RM0.665 resistance with huge volume.

How high will it go?

Other indicator:-
MACD trade at positive region, uptrend sign.
Stochastic %K on SELL call itinerary.

Higher high been confirmed, uptrend stock.
If retrace down, RM0.665 would be immediate support level.
Subsequent support @ MA20 level.

Let's watch closely.

Sunday, July 8, 2012

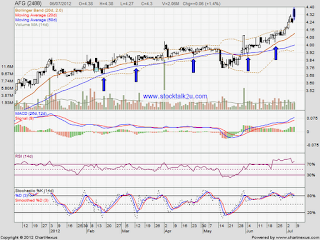
Technical Analysis July 2012: AFG (2488)


ALLIANCE FINANCIAL GROUP BHD (2488)

Observation from Chart:

AFG formed reversal candlestick @ RM4.38 level.

What's the immediate support level?

Other indicator:-
MACD trade at positive region, uptrend sign.
Stochastic %K already trigger SELL call.

High probably it will retrace down & retest @ MA20 support level.
Subsequent support @ MA50 level.

Let's watch closely.

Technical Analysis July 2012: BJCORP (3395)


BERJAYA CORPORATION BERHAD

Observation from Chart:-

BJCORP forming bolinger band squeeze.

When will it break through the band?

Other indicator:-
MACD trade at negative region, downtrend sign.
Stochastic %K still on SELL call itinerary.

High posiblity will retest RM0.74 support level.
If rebound, MA20 / MA50 would be immediate resistance level.
Subsequent resistance would be RM0.805 level.

Let's watch closely.

Friday, July 6, 2012

Technical Analysis July 2012: IOICORP (1961)


IOI CORPORATION BERHAD

Observation from Chart:

IOICORP is forming forming ascending triangle.

Will it break through RM5.29 resistance level?

Other indicator:-
MACD trade at positive region, uptrend itinerary.
Stochastic %K on BUY call itinerary.

Immediate resistance, RM5.29 level.
Immediate support, MA20 level.

If the bull strong enough, it might break through.
Else, it might retest lower triangle support level.

Let's watch closely.

Technical Analysis July 2012: CYPARK (5184)


CYPARK RESOURCES BERHAD

Observation from Chart:

CYPARK retest RM1.83 support level.

Will it rebound?

Other indicator:-
1. MACD trade at positive region, uptrend sign.
2. Stochastic %K trigger SELL call, pending confirmation.

As long as higher high & higher low is sustainable, uptrend will be continue.
Immediate support @ RM1.83
Subsequent support @ MA50 / MA20 level.

Immediate resistance @ RM1.95
Subsequent resistance @ RM2.03 level.

Let's watch closely...

Thursday, July 5, 2012

Technical Analysis July 2012: TAANN (5012)


TA ANN HOLDINGS BERHAD

Observation From Chart:-

TAANN seem like forming ascending triangle.

Will it break through RM4.80 resistance level?

Other indicator:-
MACD trade at negative region, downtrend itinerary.
Stochastic %K been trigger BUY call.

Immediate resistance, MA50 level.
Immediate support, MA20 level.

If the bull strong enough, it might break through.
Else, it might retest lower triangle support level.

Let's watch closely.

Technical Analysis July 2012: SUPERMX (7106)


SUPERMAX CORPORATION BERHAD

Observation From Chart:-

SUPERMAX retest MA20 support level.

Will it rebound?

Other indicator:-
MACD at positive region, uptrend sign.
Stochastic %K still on SELL call itinerary.

If rebound, immediate resistance would be RM2.13 level.
If break down MA20, immediate support @ RM1.93 level.
Subsequent support @ MA50 level.

Do follow up: Mystery disease in Cambodia kills 61 children
http://www.boston.com/news/world/asia/2012/07/04/mystery-disease-cambodia-kills-children/9JFOwwQxvX0k5brVKxUxzH/story.html

Let's watch closely.

Tuesday, July 3, 2012

Technical Analysis July 2012: THPLANT (5112)


TH PLANTATIONS BERHAD

Observation from Chart:-

THPLANT is forming descending triangle with RM2.18 support.

Will it break through upper triangle line resistance?

Other indicator:-
MACD trade at negative region, downtrend itinerary.
Stochastic %K already trigger BUY call.

If able break through upper triangle line, next resistant would be RM2.50 level.
However, if retrace down, it might retest RM2.18 support level again.

Let's watch closely...

Technical Analysis July 2012: CIMB (1023)


CIMB GROUP HOLDINGS BERHAD

Observation From Chart:

CIMB succeed break through bolinger band squeeze.

How high will it go?

Other indicator:-
1. MACD trade at positive region, uptrend sign.
2. Stochastics %K already trigger BUY call.

High probably will break through immediate resistance RM7.70 level.
Subsequent resistance RM7.91 level.
If retrace down, MA20 / MA50 immediate support level.

Let's watch closely.

Monday, July 2, 2012

Technical Analysis July 2012: IVORY (5175)


IVORY PROPERTIES GROUP BERHAD

Observation from Chart:-

IVORY retest RM0.55 level again.

Will it break through?

Other indicator:-
MACD at negative region, it is downtrend itinerary.
Stochastic %K already trigger BUY call.

Immediate resistant RM0.55 level.
Immediate support MA20 / MA50 level.

If market sentiment is bullish, high potential IVORY will break through RM0.55 level.

Let's watch closely.